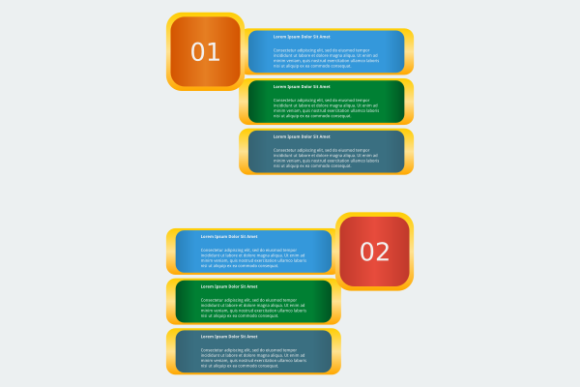
How to Use the Columned Lists Infographic Template for Clear Visual Communication
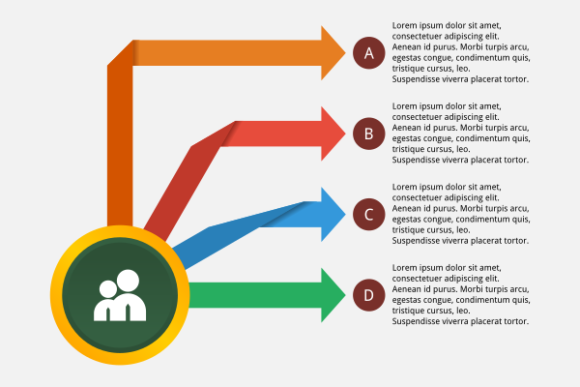
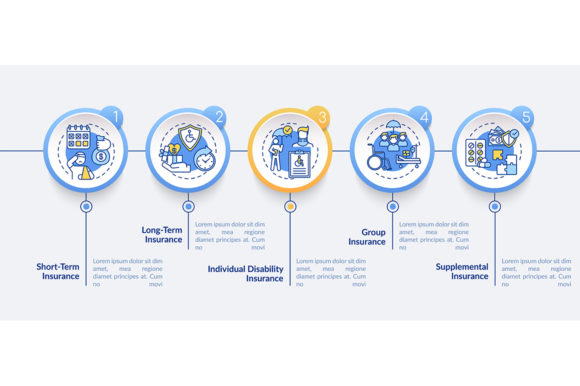
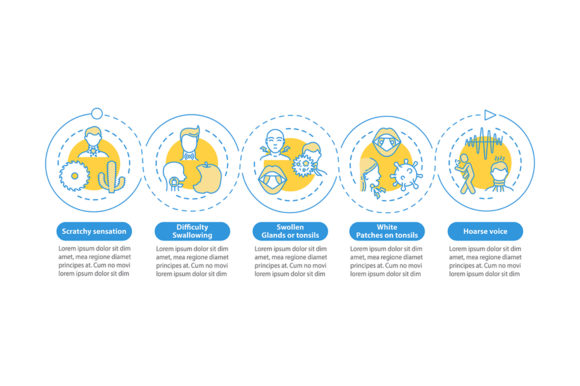
The Columned Lists Infographic Template is a flexible and efficient visual tool designed to present structured information in a clean, organized format. Whether you're summarizing data, comparing options, or outlining a multi-step process, this template allows you to display content across multiple columns for improved readability and visual flow. Built as an editable SVG vector, it offers scalability and adaptability across various formats including EPS, PDF, and high-resolution PNG, making it ideal for both digital and print use.
Understanding the Structure and Use Cases
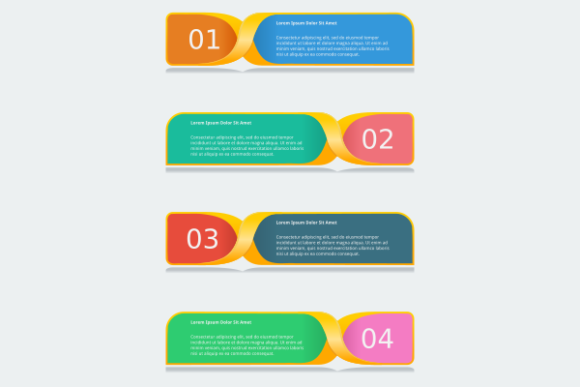
At its core, the Columned Lists Infographic Template organizes content into vertical columns, each capable of holding text, icons, or data points. This format is particularly effective for:
- Comparing features or options side-by-side
- Presenting multi-phase workflows or timelines
- Summarizing key points in reports, presentations, or marketing materials
- Displaying educational content such as pros and cons, definitions, or classifications
Because of its modular layout, this template integrates well into a wide range of professional and personal contexts. For example, marketers can use it to highlight product comparisons, educators can break down complex topics into digestible sections, and project managers can outline task assignments or project phases with visual clarity.
Integrating into Workflows: Before, During, and After
One of the strengths of the Columned Lists Infographic Template lies in its versatility across different stages of a process. Here's how it can be used effectively throughout a project lifecycle:
Before Starting a Project
Use the template to create a visual roadmap or planning document. For instance, if you're launching a new product, you might set up columns for Research, Development, Marketing, and Launch phases. This helps stakeholders understand the overall structure and align expectations early on.
During Execution
As the project progresses, the same template can be updated to reflect current status, responsibilities, or milestones. This dynamic use keeps teams informed and allows for real-time tracking of progress without the need for complex dashboards or tools.
After Completion
Post-project, the template can serve as a summary or retrospective document. You can use columns to highlight key learnings, outcomes, and next steps. This format is especially useful for internal documentation or client-facing reports where clarity and visual appeal matter.
Compatibility and Editing with Inkscape
The Columned Lists Infographic Template is delivered as an SVG vector file, which means it maintains quality at any scale. This makes it ideal for responsive web design, high-resolution print, and scalable presentations. While the template can be edited in various vector software, it is recommended to use Inkscape, a free and open-source tool that supports SVG, EPS, and PDF formats.
Using Inkscape allows for precise editing of text, colors, and layout elements. It also supports layers and grouping, which helps maintain organization when making complex changes. Additionally, you’ll receive EPS, PDF, and PNG versions in the ZIP file, ensuring compatibility with platforms that may not support SVG files.
Practical Tips for Implementation
Here are several actionable tips to help you make the most of the Columned Lists Infographic Template within your workflow:
- Define your purpose clearly before populating the template. Are you comparing options, explaining a process, or summarizing data? Your goal will determine how you structure each column.
- Limit the number of columns based on readability. While the template supports multiple columns, too many can overwhelm the viewer. Three to five columns typically offer the best balance between detail and clarity.
- Use consistent formatting across each column to maintain visual harmony. This includes font sizes, colors, icon styles, and spacing.
- Include visual cues like icons or color coding to highlight differences or similarities between columns. This enhances comprehension and makes the information more engaging.
- Export for different platforms using the included file formats. For example, use the SVG for web use, the PDF for print or sharing, and the PNG for social media or presentations where vector support is limited.
Workflow Integration Examples
Let’s explore a few real-world scenarios where the Columned Lists Infographic Template can be integrated smoothly:
Marketing Campaign Planning
A digital marketing team can use the template to outline campaign elements such as Goals, Channels, Budget, and KPIs. Each column can represent a different channel (e.g., social media, email, paid ads) and include key metrics and action items.
Curriculum Development
Educators or instructional designers can structure course modules using the template. Each column might represent a week or unit, with sections for topics, resources, assignments, and assessments.
Product Feature Comparison
For SaaS companies or e-commerce platforms, the template can be used to compare product tiers or competitor offerings. Columns can represent different plans (Basic, Pro, Enterprise) with corresponding features and pricing.
Ensuring Long-Term Use and Reusability
To maximize the value of the Columned Lists Infographic Template, consider the following best practices:
- Save customized versions of the template for common use cases. For example, keep a version for comparison charts, another for project timelines, and another for educational outlines.
- Establish a naming convention for saved files to make them easy to locate and reuse in the future.
- Update templates as needed to reflect changes in tools, branding, or workflows. This ensures that your visual materials remain relevant and aligned with current standards.
- Share with team members so everyone can benefit from a consistent visual language. This is especially useful for organizations that produce regular reports, presentations, or marketing materials.
Final Thoughts on Practical Use
The Columned Lists Infographic Template is more than just a design asset—it's a strategic tool for organizing and presenting information clearly. Whether you're preparing a presentation, documenting a process, or creating marketing materials, this template helps you communicate complex ideas in a structured and visually appealing way.
By understanding how to integrate it into your planning, execution, and review phases, you can streamline your workflow and improve how you share and retain information. Paired with the right editing tools like Inkscape and a thoughtful approach to formatting and reuse, this template becomes a reliable part of your productivity toolkit.