Understanding Ecological Damage Through Visual Storytelling: The Power of Vector Infographics
Visualizing Environmental Impact with Precision
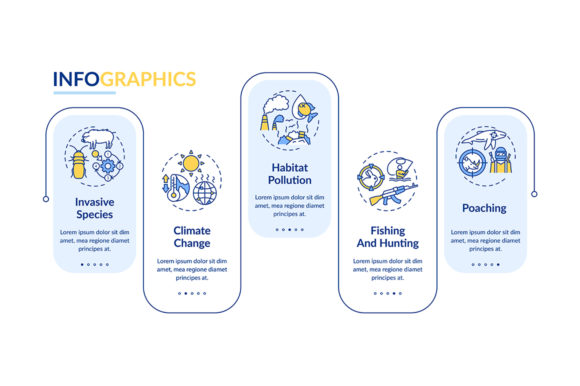
Ecological damage is often complex, involving multiple layers of data that span pollution sources, affected habitats, and long-term consequences. Communicating this information effectively requires tools that not only simplify complexity but also engage the viewer. The Ecological Damage Vector Infographic offers a structured, visually compelling way to present environmental degradation in a digestible format.
Whether used in research reports, educational materials, or corporate sustainability presentations, these infographics provide clarity where raw data might overwhelm. The vector format ensures scalability without loss of quality, making them ideal for both digital and print applications.
Designing for Clarity: Habitat Pollution Presentation Elements
One of the most effective applications of the Ecological Damage Vector Infographic is in habitat pollution presentations. Designers can integrate icons representing pollutants, affected species, and restoration efforts to create a cohesive visual narrative. These presentation elements often include:
- Customizable icons for pollutants like oil spills, plastic waste, and chemical runoff
- Color-coded layers to indicate severity levels of contamination
- Maps and timelines showing the spread and impact of pollution over time
By using a consistent visual language, presenters can guide their audience through the degradation process, helping them understand not just what happened, but why it matters.
Data Visualization in Five Steps
Creating a compelling data visualization starts with a clear process. Here’s a five-step approach using the Ecological Damage Vector Infographic template:
- Define the scope: Determine which environmental factors to highlight—air, water, soil, biodiversity loss, or a combination.
- Collect and organize data: Use credible sources such as government environmental reports or peer-reviewed studies.
- Select visual metaphors: Choose icons and layouts that represent the data meaningfully, such as fish icons for aquatic life decline or smoke symbols for air pollution.
- Build the layout: Arrange elements in a logical flow, whether linear, radial, or thematic, depending on the story you want to tell.
- Refine and export: Adjust colors, labels, and scale for clarity, then export in the required format (EPS, JPG, PNG, SVG, or AI).
This structured approach ensures that even the most intricate environmental datasets can be communicated with clarity and impact.
Process Timeline Charts: Mapping Ecological Decline Over Time
Understanding how ecological damage unfolds over time is crucial for both analysis and advocacy. A process timeline chart embedded within an Ecological Damage Vector Infographic can illustrate key events such as industrial expansion, policy changes, or natural disasters and their environmental consequences.
For instance, a timeline might show the progression of deforestation in a region, correlating it with logging activity, agricultural expansion, and species extinction rates. These timelines can be annotated with icons, graphs, and brief descriptions to enhance comprehension without overwhelming the viewer.
Workflow Layouts with Linear Icons: A Streamlined Approach
For audiences needing to understand processes—like how pollution enters water systems or how habitat restoration works—a workflow layout is invaluable. These layouts use linear icons to represent each step in a sequence, offering a minimalist yet informative approach.
Designers often use such workflows to:
- Show the life cycle of pollutants
- Illustrate the steps in ecological restoration projects
- Explain regulatory compliance processes in environmental law
Because the icons are vector-based, they can be resized, recolored, and rearranged without compromising quality, making them adaptable to a wide range of presentation styles and platforms.
File Formats and Flexibility: What’s Included in the ZIP Package
The Ecological Damage Vector Infographic template typically comes in a ZIP file containing multiple formats to suit different needs:
- EPS (Encapsulated PostScript): Ideal for high-quality print and vector editing in Adobe Illustrator.
- JPG (Joint Photographic Experts Group): Suitable for web use and presentations where file size matters.
- PNG (Portable Network Graphics): Offers transparency and high quality for overlaying on other visuals or slides.
- SVG (Scalable Vector Graphics): Perfect for responsive web design and interactive dashboards.
- AI (Adobe Illustrator): Allows for full customization by graphic designers.
This variety ensures that users—from educators to environmental scientists—can choose the format that best fits their application, whether it's a printed poster, a digital report, or a dynamic presentation.
Use Cases Across Industries and Audiences
The versatility of the Ecological Damage Vector Infographic makes it suitable for a wide array of users and applications:
- Educators: Can use these visuals to teach students about environmental science in a more engaging way.
- Researchers: May integrate them into publications to summarize findings visually.
- Businesses: Can showcase sustainability efforts or environmental impact assessments in annual reports.
- NGOs: Often use them in campaigns to raise awareness about pollution and conservation.
- Policy makers: Benefit from clear, data-backed visuals when presenting environmental legislation proposals.
Each use case benefits from the infographic’s ability to distill complex ecological data into meaningful, shareable content.
Choosing the Right Infographic Template for Your Message
When selecting an Ecological Damage Vector Infographic template, consider the following:
- Target audience: Is the infographic intended for experts, students, or the general public?
- Platform: Will it be used online, in print, or in a presentation?
- Message focus: Are you highlighting causes, effects, solutions, or a combination?
Templates often come with pre-designed layouts tailored for specific topics like water pollution, deforestation, or climate change, allowing users to get started quickly while still customizing the design to fit their needs.
Best Practices for Effective Environmental Data Presentation
To maximize the impact of your Ecological Damage Vector Infographic, follow these best practices:
- Keep it simple: Avoid clutter by focusing on the most relevant data points.
- Use consistent colors: Align color schemes with environmental themes—greens for forests, blues for water, etc.
- Label clearly: Ensure all icons and charts are labeled for quick understanding.
- Tell a story: Guide the viewer from problem to impact to potential solution.
- Cite sources: Maintain credibility by including data references and sources.
These practices ensure that your infographic not only looks professional but also communicates its intended message effectively.
Conclusion: Infographics as Tools for Awareness and Action
As ecological challenges become more pressing, the need for clear, impactful communication grows. The Ecological Damage Vector Infographic serves as a bridge between data and understanding, enabling diverse audiences to grasp environmental issues at a glance. Whether used in education, advocacy, or corporate reporting, these infographics empower users to convey complex ecological damage narratives with clarity, precision, and visual appeal.